20

The Nyquist Limit is frequently mentioned in the context of lens and sensor resolution.
What is it and what is its significance to photographers?

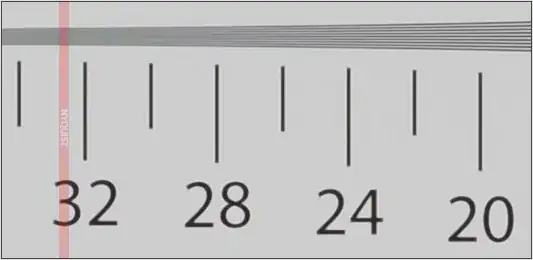
Here is an example of it being used by DPReview.com in their resolution testing.

Vertical resolution of the Nikon D7000

mattdm
  • 143,140
  • 52
  • 417
  • 741
labnut
  • 8,297
  • 3
  • 34
  • 55

3 Answers3

29

Please note that the following is a simplification of how things actually work

Background:

In digital photography, a light pattern is focused by the lens onto the image sensor. The image sensor is made up of millions of tiny light-sensitive sensors whose measurements are combined to form a 2-dimential array of pixels. Each tiny sensor produces a single light intensity measurement. For simplicity, I will look at the 1-dimensional case. (Think of this as a slice that looks at only a single row of pixels).

Sampling:

Our row of tiny sensors, each of which is measuring a single point of light, is performing sampling of a continuous signal (the light coming through the lens) to produce a discrete signal (light intensity values at each evenly spaced pixel).

Sampling Theorem:

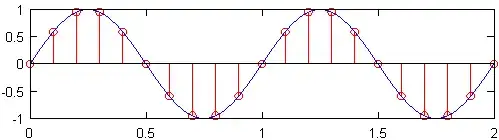
The minimum sampling rate (i.e., the number of sensors per inch) that produces a signal that still contains all of the original signal’s information is known as the Nyquist rate, which is twice the maximum frequency in the original signal. The top plot in the figure below shows a 1Hz sine wave sampled at the Nyquist rate, which for this sine wave is 2Hz. The resulting discrete signal, shown in red, contains the same information as the discrete signal plotted beneath it, which was sampled at a frequency of 10Hz. While a slight over simplification, it is essentially true that no information is lost when the original sample rate is known, and the highest frequency in the original signal is less than half the sample rate.

sampling at 2f sampling at 10f

Effects of under sampling:

If the sample frequency were less than 2 times the maximum frequency of the signal, then the signal is said to be under sampled. In that case, it is not possible to reconstruct the original continuous signal from the discrete one. An illustration of why this is the case can be found in the figure below. There, two sine waves of different frequencies sampled at the same rate produce the same set of discrete points. These two sine waves are called aliases of each other.

Aliases

All discrete and digital signals have an infinite number of aliases, which correspond to all the sine waves that could produce the discrete signals. While the existence of these aliases may seem to present a problem when reconstructing the original signal, the solution is to ignore all signal content above the maximum frequency of the original signal. This is equivalent to assuming that the sampled points were taken from the lowest possible frequency sinusoid. Trouble arises when aliases overlap, which can happen when a signal is under sampled.

But Photographs Don't Look Like Sinusoidal Waves. How is all this Relevant?

The reason all of this matters for images is that through application of the Fourier Series, any signal of finite length can be represented as a sum of sinusoids. This means that even if a picture has no discernable wave pattern, it can still be represented as a sequence of sinusoids of different frequencies. The highest frequency that can be represented in the image is half the Nyquist rate (sampling frequency).


Meanings of Similar Terms:

Nyquist rate - The lowest possible sampling frequency that can be used while still guaranteeing the possibility of perfect reconstruction of the original continuous signal.

Nyquist frequency - The highest frequency continuous signal that can be represented by a discreet signal (for a given sampling frequency).

These two terms are two sides of the same coin. The first gives you a bound on sampling rate as a function of max frequency. The second gives you the max possible frequency as a function of sampling rate. See Wikipedia: Nyquist frequency for further reading.

Nyquist Limit is another name for Nyquist frequency. See wolfram.com: Nyquist Frequency

Sean
  • 3,837
  • 2
  • 30
  • 48
  • 3
    Superb answer! The part about under sampling is particularly useful. – jrista Apr 10 '11 at 19:12
  • 1
    Thanks. I adapted it from a paper I wrote a few years ago for one of my electrical engineering classes. – Sean Apr 10 '11 at 19:16
  • @Sean So sampling at the Nyquist rate completely determines the Fourier series expansion of any wave, is that correct? – Uticensis Apr 10 '11 at 19:54
  • @Billare - Short answer: Yes. Long answer: For some waves (like a true square wave), the Nyquist rate is infinity, so you can't fully reconstruct it from a discrete signal; you can only approximate it. See: http://mathworld.wolfram.com/FourierSeriesSquareWave.html – Sean Apr 10 '11 at 20:48
  • 3
    So, here's a question I have. The photosites aren't actually theoretical point samples; they cover an actual area. (Or, in the one-dimensional case, a short length — but not a point.) Does this have any practical impact on application of the theory to reality? – mattdm Apr 10 '11 at 23:35
  • 1
    @mattdm - That's a very interesting question. In the context where I studied sampling (time changing electrical signals), the duration over which each sample was taken was never large relative to the sample rate, so it was never an issue. As far as I am willing to speculate, the effect might be similar to applying a low-pass filter that had a cutoff frequency very near to the sampling frequency. Such a filter would attenuate (but not completely remove) the very high frequency content of the image. – Sean Apr 11 '11 at 01:08
  • But since the sampling frequency is twice that of the Nyquist frequency (the highest reproducible frequency), there really shouldn't be any content at that frequency anyway. If that is the case (and I'm really just guessing here), then not much important image content would be touched. Just a little of the very high frequency content would lose contrast. – Sean Apr 11 '11 at 01:08
  • 1
    This video might help you visualize aliasing: http://www.youtube.com/watch?v=yIkyPFLkNCQ -- The "frequency" keeps increasing until it hits the Nyquist frequency (at about 0:37), after which the wave appears to reverse direction and decrease in "frequency" back down to 0. – Evan Krall May 02 '11 at 07:44
  • @mattdm The point about each pixel not being a point sample is really not true. (No matter how small a "real" point is it has a finite area. Only theoretical points have no area.) The output of each pixel is actually a single voltage that represents the average light falling on that pixel in the time frame sampled. (The voltage is analog to digital converted so is, therefore, one number.) –  Sep 07 '16 at 19:10
10

The Nyquist Limit is mostly used in digital sound recording, but it also applies to digital photography.

In digital sound recording, the highest frequency sound that you can possibly record is half of the sampling frequency. A sound recording av 44100 kHz can not record any sound frequencies above 22050 Hz.

In photography it means that you can't possibly capture a wave pattern where the waves are closer together than two pixels.

In sound recording, everything is frequencies, so the Nyquist Limit is always relevant. In photography you don't often have wave patterns that are affected, so it's mostly used as a theoretical limit of the resolution of the sensor.

You can see the effect of this limit in a few situations where there is a horisontal or vertical wave patterns in a photo, like for example taking a picture where there is a window at a distance with the blinds pulled. If the blades in the blind are closer than two pixels, you can't distinguish the separate blades. However, you are more likely to see a wave pattern that is not exactly horizontal of vertical; it is in that case you will instead see the effect of jagged edges or moiré patterns which occur before the Nyquist Limit.

nchpmn
  • 372
  • 2
  • 10
Guffa
  • 21,309
  • 3
  • 58
  • 85
  • 9
    Everything in photography is also frequencies. Digital cameras take a sample of an analog signal. At that point, it doesn't really matter if the signal is sound or light. This answer seems to imply that the limit only applies to certain patterns in a scene, which isn't right. – mattdm Apr 10 '11 at 12:22
  • OK, the above illustration was taken from DPReview's review of the Nikon D7000 which has a pixel size of 4928 x 3264. How did they use this to arrive at the Nyquist Limit on the above image? – labnut Apr 10 '11 at 12:54
  • 2
    @mattdm: You are missing the point completely. Sound consists of waves that have a duration along the recording. Although light have different wave lengths, each photon only hits a single pixel on the sensor, so the Nyquist Limtit doesn't apply to the light frequencies at all. It only applies to photographs where you actually have a wave pattern that spans an area of pixels, and the frequency is the distance between waves in the pattern, so it has nothing to do with light frequencies. – Guffa Apr 10 '11 at 16:19
  • 1
    @labnut: They measure the resolution in the unit LPH, lines per hight, so the Nyquist Limit is equal to the height of the image in pixels; 3264 LPH. The scale shows LHP/100, so the Nyquist Limit is at 32.64 on the scale. Note that they are counting both black and white lines, while if you expressed it as a frequency, a black and white line would be a single wave length, and all the values would be half. – Guffa Apr 10 '11 at 16:34
  • 4
    It doesn't matter. The image is still an analog signal. The point is that all photographs have a pattern that span an area of pixels. In fact, every photograph is such a pattern, spanning all of the pixels. In some cases (as the ones you are talking about) you may see artifacts caused by the sampling. But in all cases, the resolution is limited. (A more interesting objection is that photosites are not points but actually cover an area; I have no idea how that factors in.) – mattdm Apr 10 '11 at 16:41
  • 1
    @mattdm: You are still missing the point. The Nyquist Limit only applies if there is a wave pattern along a set of samples. If there is no wave pattern, the Nyquist Limit doesn't apply, and the resolution is simply the distance between the pixels. – Guffa Apr 10 '11 at 16:54
  • 3
    @Guffa, @mattdm, the light falling on the sensor is a wave pattern. The Nyquist limit applies because each photo site is a sample of the incident wave form. The Nyquist Limit says that we can only reproduce a sampled waveform if the sampling frequency is >= 1/2 the incident frequency. The number of photo sites determines the sampling frequency and therefore the Nyquist Limit. – labnut Apr 10 '11 at 17:17
  • 8
    @Guffa, a digital image is a 2D wave pattern (really three, one for each color channel), not in terms of the frequency of light waves but in terms of alternating light and dark pixels that make up the image. The fact that light is itself a wave is not directly relevant to the use of the Nyquist–Shannon theorem for measuring sensor resolution. – Sean Apr 10 '11 at 17:38
  • @labnut: No, the light falling on the sensor are distinct waves, and doesn't have to be a pattern. The Nyquist Limit only applies if the picture actually resembles a horisontal or vertical wave pattern. – Guffa Apr 10 '11 at 17:46
  • 1
    @Sean: The image is only a wave pattern if the image actually resembles a wave pattern. If not, then it's just a pattern. You are right that the fact that light itself is a wave is not relevant, and if you read the conversation you will see that it's what I have been saying all along. – Guffa Apr 10 '11 at 17:51
  • @Guffa, the Nyquist Limit applies to any waveform, no how complex its constituent frequencies. My use of the word 'pattern' is loose and should really read waveform. – labnut Apr 10 '11 at 17:59
  • 4
    @Guffa: The analog image projected by a lens is indeed a wave pattern, and the full extent of wave theory can be applied to photographic images. When we talk about waves in terms of images, were not talking discrete light waves, but the wave nature of lighter and darker elements of a 2D image. In most simplistic terms, a maximally bright pixel is the peak of a wave, where as a minimally dark pixel is the trough of the wave, when only factoring in luminosity. The problem becomes more complex when you account for R, G, and B colors, but the concept remains the same. – jrista Apr 10 '11 at 18:38
  • @labnut, @jrista: Yes, an image is a wave pattern in the sense that it can contain wave forms, but an image can also consist of only non-wave patterns (which a sound recording can't). The Nyquist Limit only applies to the image components that are actually waves, and the limit is of course always there, even if there are no wave patterns to apply it to. – Guffa Apr 10 '11 at 18:48
  • It should also be noted that the images used by DPReview are subject to the inaccuracies of their own. For one, they tend to be saved as jpegs, so the images themselves can be lossy. Second, the screen you view the images on can also affect the resolving limit of the line pairs in the image. Ironically, at least with RAW, the theoretical nyquist limit does not always seem to be a hard limit, which is probably due to the different wavelengths of red, green, and blue light and the distribution of RGB pixels in a sensor. – jrista Apr 10 '11 at 18:50
  • 1
    @Guffa: I'm confused about these non-wave patterns your referring to. To my knowledge, an image can be treated entirely as a wave pattern, and I'm not understanding this non-wave pattern bit. – jrista Apr 10 '11 at 18:51
  • @All: Its probably best to continue in the Photography Tech Chat: http://chat.stackexchange.com/rooms/367/photography-tech-chat – jrista Apr 10 '11 at 18:54
  • 2
    Don't confuse a wavelet decomposition of your image with the wave nature of light. The wavelength/frequency the Nyquist theorem is referring to is not the wavelength/frequency of the electromagnetic wave that is light, but the wavelength of a repetitive pattern in your image. – Lagerbaer Apr 10 '11 at 18:55
  • @jrista: An image that is a solid gray color doesn't have any wave components. – Guffa Apr 10 '11 at 18:57
  • 1
    @Guffa: Sure it does, its just a wave interference patterns that produces an even tone. Just because you have a solid color image doesn't mean you can't decompose the image as a waveform. Check out this page: http://brain.cc.kogakuin.ac.jp/~kanamaru/WaveletJava/JavaWaveletImage-e.html – jrista Apr 10 '11 at 19:00
  • @jrista: Yes, you can express anything as a wave, but that doesn't mean that it behaves as a wave. You can for example express a solid color as two phase inverted waves with a frequency that is higher than the Nyquist Limit, but that doesn't mean that the limit applies. The camera is still able to accurately record the image, eventhough it would not be able to accurately record any of the separate waves. – Guffa Apr 10 '11 at 20:34
  • I guess I would state that if you can express something as a wave, then while expressed as a wave it would exhibit the behaviors of a wave...or as is usually the case, as a series of waves of various frequency interfering with each other. That is pretty much the point with analyzing images in wave form, and I think thats the point everyone else was trying to make. I think Sean's answer sums it up nicely. – jrista Apr 10 '11 at 20:53
  • @jrista: Yes, expressing a non-wave component as waves is only a theoretical construct, it only behaves as waves in theory and has no practical relevance in this case. – Guffa Apr 10 '11 at 21:01
  • 1
    @Guffa - the (digital) 2D monochrome image (as per color channel) is a digitized representation of some continuous spatial function (which is the analog image projected on the sensor). This was said in the comments above. Now, to show that this digitized matrix is a superposition of harmonies, all you have to do is a 2D DFT (usually by means of FFT) on the image. Then, your 1st component of the transform is the DC level (freq. = 0) and corresponds to your "all gray" image mentioned above. The two high-freq. phase inverted waves will cancel each-other to result a some of 0. [cont...] – ysap Apr 10 '11 at 22:25
  • @Guffa - [cont 1] This is not analogous to the solid gray image. Now, once you have your decomposed (freq. analyzed) matrix, you can see the relationship between the original image plane and the Nyquist freq., determined by the pixel spatial resolution. If the analog image contains frequencies higher than the relevant Nyquist freq. of the sensor, then you might see aliasing artifacts in the digitized image. This is the reason why there is the low-pass filter in front of the sensor - to clip the higher than Nyquist frequencies. This is 1:1 analogous to the 1D digitized sound recordings. – ysap Apr 10 '11 at 22:29
6

Just to add to the previous answers... if you have a pattern beyond the Nyquist limit, you may experience aliasing — i.e. it may show as a lower frequency pattern in the image. This used to be very apparent on things like checked jackets on TV. Therefore, you do need a low pass anti-aliasing filter before sampling so that this artifact is not a problem.

mattdm
  • 143,140
  • 52
  • 417
  • 741
John
  • 564
  • 3
  • 9