This is a projection problem, your data is probably fine. Your polygons are cut by the limits of the projection you are using to visualize. It seems to be 3857 (web mercator, the default of many tools), so the limit is the 180° longitude, the line somewhere around the changing date, a little bit in russia down until new zealand:
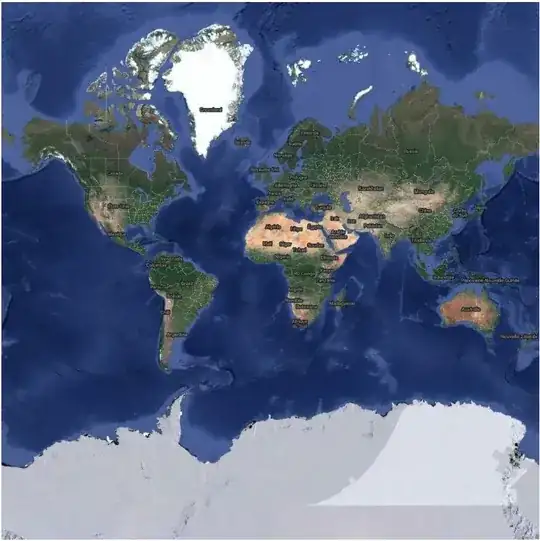
When drawing, each line will be drawn between two consecutives points using the shortest path available, but in projection 3857 the path between alaska and below russia is across the world, it cannot teleport from one side of the map to the other (just imagine you have a rectangular paper map, don't be fooled by the fact the map is repeated right and left in the web visualization).
If you want to correctly display this polygon, you need to either split the polygon using the line at longitude 180° and latitude -90° to 90°, or change the projection you use to visualize your data. Try display your geom usin QGis with the projection
102016 for example (which is polar), or try to find a projection that is centered along the 180° longitude instead of the 0° longitude if all your data is around the pacific ocean (some idea here: https://gis.stackexchange.com/a/138779/120505).


