7

I have a very simple map (http://www.nyc.gov/html/dcp/download/bytes/nybb_15b.zip) and I have never before worked with shapefiles in any way. Can someone tell me what I need to do in order to change each borough's colour and to remove the outline? (Usually I use Python.)

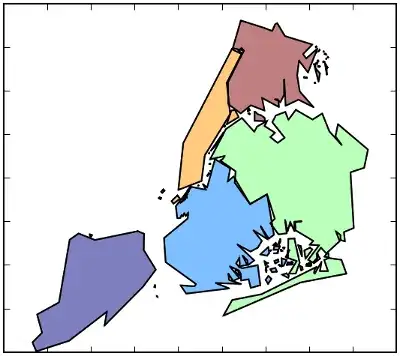
The map below was made with (Geo-)Pandas. But after a few hours of research, I don't even know whether the colours could be changed with something that comes with the Anaconda package.

boros = GeoDataFrame.from_file('nybb/nybb.shp')
boros.plot()

enter image description here

underdark
  • 84,148
  • 21
  • 231
  • 413

1 Answers1

10

Geopandas plot takes a colormap parameter

The parameter is called cmap. There's an alias for it called colormap but it should not be used anymore.

GeoDataFrame.plot(column=None, cmap=None, alpha=0.5, categorical=False, legend=False, axes=None)

The pandas documentation mentions colormaps such as

cmap='cubehelix'
cmap='Greens'
cmap='winter'
Richard D
  • 462
  • 2
  • 8
underdark
  • 84,148
  • 21
  • 231
  • 413
  • Thanks underdark. Your links are dead. I guess these are current addresses for 1st and 2nd. BTW colour maps are ready-made choices, which I might not like for my map. Worth to see this way of assigning your own colour-choices to each feature row? (based on a given column value) – abu Jan 26 '22 at 11:59