1

I'd like to calculate the total area of several polygons along a north-south axis. A bit like this http://www.closr.it/canvas/1307/#/spot

total area ~ latitude

There is a similar question with R : Spatial graphing, distribution of polygon area over latitudes . But I was wondering if there was not a simpler solution with QGIS, and if possible in a continuous way, not a discrete one.
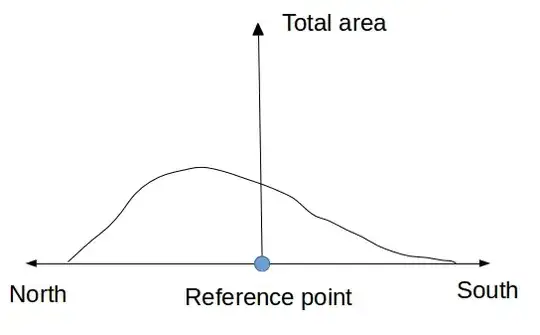
PolyGeo
  • 65,136
  • 29
  • 109
  • 338
bonzinor
  • 177
  • 6
  • Actually this answer is great : http://gis.stackexchange.com/a/24541/51989 But it is designed for the intersection with 1 polygon and I'd like to get the sum of all the polygons inside each row. I'm trying to edit the code but have some problems... – bonzinor Jun 05 '15 at 00:58
  • A minor modification (simplification, actually) of the R code at http://gis.stackexchange.com/a/33449 will give you your continuous solution. The code conducts a vertical (north-south) line sweep, finding its intersection with a polygon (or, just as easily, a set of polygons). You simply want to track the total length of the intersection. When you use a cylindrical equal-area projection, these lengths are exactly what you want to be plotting in your graph (which does not actually show total area: it is the area density per unit distance north-south). – whuber Jun 05 '15 at 16:37
  • Thanks a lot for your answer, but this code is a bit tricky for me since I don't have that much experience with R. I don't know how to edit it to get what I want. Instead, I used a grid and summed intersecting area by row. Then I plotted the sum ~ Y_MAX of the row. It's discrete but still accurate. – bonzinor Jun 06 '15 at 12:37

1 Answers1

1

As commented by @whuber:

A minor modification (simplification, actually) of the R code at gis.stackexchange.com/a/33449 will give you your continuous solution. The code conducts a vertical (north-south) line sweep, finding its intersection with a polygon (or, just as easily, a set of polygons). You simply want to track the total length of the intersection. When you use a cylindrical equal-area projection, these lengths are exactly what you want to be plotting in your graph (which does not actually show total area: it is the area density per unit distance north-south).

PolyGeo
  • 65,136
  • 29
  • 109
  • 338