6

I have several shapefiles representing bus lines with different colors for each segment, however, because the lines are exactly superposed, only the shapefile on top can be seen. Is there a way to display the lines underneath for example side-by-side on these parts of segments where several lines converge (there might be 4 or 5 of them)? The polylines are made up of series of segments.

I know there are some tools in ArcGIS, but I'm using QGIS 2.8.0

enter image description here

Chris W
  • 15,720
  • 2
  • 29
  • 47
  • 2
    The answer is dependent on the GIS software; please edit the question to specify the software (with version) – Vince Mar 28 '15 at 21:01
  • And if you're using ArcGIS you should probably check out http://gis.stackexchange.com/questions/27806/cartographic-techniques-for-symbolizing-routing-data and all the questions linked to it (see the Linked heading on the right side of the page). – Chris W Mar 29 '15 at 02:45
  • http://gis.stackexchange.com/questions/53654/ might help. – Chris W Mar 30 '15 at 19:15

1 Answers1

4

In QGIS 2.8.0 you can do that with the offset option in the Style Layer Properties. In my example with three polylines (they are exactly superposed too):

enter image description here

Click in "Simple line" of line2 to display "Offset" option (I set 1 mm):

enter image description here

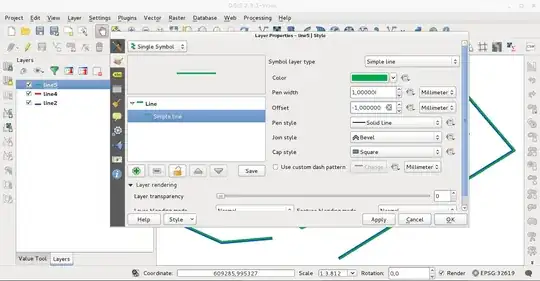
Click in "Simple line" of line5 to display "Offset" option (I set -1 mm):

enter image description here

The result obtained (Offset of line4 unchanged; 0 mm):

enter image description here

Editing note (answering to alpha-beta-soup comment):

With the next code, executed in the Python Console of QGIS, I have the same result:

from PyQt4.QtGui import *

mc=iface.mapCanvas()

layers=[]
renderer = []

n = mc.layerCount()

symbol = range(n)

symbol[0] = QgsLineSymbolV2.createSimple({'color':'green',
                                       'width':'1',
                                       'offset':'1.0'})

symbol[1] = QgsLineSymbolV2.createSimple({'color':'red',
                                       'width':'1',
                                       'offset':'0.0'})

symbol[2] = QgsLineSymbolV2.createSimple({'color':'blue',
                                       'width':'1',
                                       'offset':'-1.0'})


for i in range(n):
    layers.append(mc.layer(i))

for layer in layers:
    renderer.append(layer.rendererV2())

for i in range(n):
    renderer[i].setSymbol(symbol[i])

iface.mapCanvas().refresh()

for layer in layers:
    iface.legendInterface().refreshLayerSymbology(layer)
xunilk
  • 29,891
  • 4
  • 41
  • 80
  • 2
    Problem I foresee with this is it is very manual, and bus routes are very many. Is there a way to access a field to control the offset? Ideally, there'd be a way to offset only in the presence of an overlap. It'd be possible to write code to consider such a condition - but it comes back to a need to use a field to control offset. – alphabetasoup Apr 07 '15 at 02:31
  • 1
    @alpha-beta-soup I wrote some code for using in the Python Console of QGIS. – xunilk Apr 07 '15 at 09:38