12

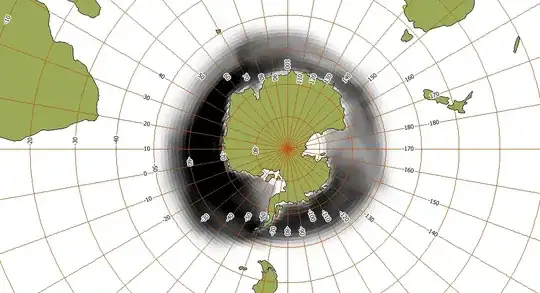
I obtained a netCDF raster file, but I couldn't get any metadata to get the name of the coordinate system the raster has been built on. The raster itself doesn't have any coordinate system embedded. I thought it would just be a WGS84, and it looked like that at first glimpse, but with further investigation in ArcMap, I saw that it is a rather not common system. Here is how it displays: enter image description here

The orange raster is a normal raster in WGS84 which I have inserted here for comparison purposes. The purple one is the raster with the unknown coordinate system. Do you have any clue what this might be?

Some updates: Here is the netCDF raster: https://www.dropbox.com/s/nottbl9yt6dwss6/sic_average_nclimate.nc?dl=0 I was also able to get some metadata from the image provider:

netcdf sic_average_nclimate {
dimensions:
    nlon = 361 ;
    nlat = 90 ;
    nseas = 4 ;
variables:
    float SIC_Change(nlat, nlon) ;
        SIC_Change:Title = "Gridded Multi-Model Ensemble Mean Annual Mean Change in Ice Concentration 21C-20C" ;
    float SIC_Season_Change(nseas, nlat, nlon) ;
        SIC_Season_Change:Title = "Gridded Multi-Model Ensemble Mean Seasonal Mean Change in Ice Concentration 21C-20C" ;
    float SIC_Change_STD(nlat, nlon) ;
        SIC_Change_STD:Title = "Gridded Multi-Model Standard Deviation of the Annual Mean Change in Ice Concentration 21C-20C" ;
    float SIC_Season_Change_STD(nseas, nlat, nlon) ;
        SIC_Season_Change_STD:Title = "Gridded Multi-Model Standard Deviation of the Seasonal Mean Change in Ice Concentration 21C-20C" ;
    float LAT(nlat) ;
        LAT:Title = "Latitude" ;
    float LON(nlon) ;
        LON:Title = "Longitude" ;

// global attributes:
        :Title = "Ice Concentration metrics for Model subset as in Figure 1 of NCLIMATE paper" ;

They show the boundary lat-long, but apparently not any information regarding the coordinate system.

multigoodverse
  • 1,545
  • 5
  • 18
  • 31
  • 1
    Antarctica is usually in Polar Stereographic Projection so everything is going north from south pole. http://nsidc.org/data/polar_stereo/ps_grids.html – Mapperz Dec 16 '14 at 15:06
  • 1
    Weird, looks like 0-360, but why is it plotting in the northern hemisphere? – mkennedy Dec 16 '14 at 17:12
  • 1
    If the reported extents in the NetCDF header look like lat/lon, but are lat: 0 to ?, lon: 0 to 360. Can you hack them to lat: -90 to (? - 90) and lon: -180 to +180? – mkennedy Dec 16 '14 at 18:33
  • @Mapperz & mkennedy, I tried to assign it a Polar Stereographic Projection, but it didn't work. I can probably mirror it vertically downwards, but it's right side half will be still beyond 180E longitudes. I opened the netCDF with notepad, but could not find any information related to lat,long. I am attaching the raster in the question if you're curious to open it on your side. – multigoodverse Dec 17 '14 at 08:34
  • That link doesn't work - dropbox says "the owner hasn't authorised access". – BradHards Dec 19 '14 at 09:43
  • @BradHards sorry for that. I just updated the question with a working link. – multigoodverse Dec 19 '14 at 09:50
  • The NetCDF file is model output and each pixel seems to be assigned to a lat and lon coordinate. Thus it would appear to be built on the latitude longitude coordinate system. The 360 longitude points are probably degrees East. – nicholaschris Dec 19 '14 at 11:41
  • @nicholaschris, yes, it is obviously a geographical coordinate system, but which particular one? – multigoodverse Dec 19 '14 at 11:54

3 Answers3

7

You can shift the data into the correct position using these GDAL commands:

gdal_translate -a_srs EPSG:4326 -a_ullr 0 0 360 -90 NETCDF:"sic_average_nclimate.nc":SIC_Change change360.tif
gdalwarp -t_srs WGS84 change360.tif change180.tif  -wo SOURCE_EXTRA=1000 --config CENTER_LONG 0

(with a little help by Frank Warmerdam: How to reproject raster from 0 360 to -180 180 with cutting 180 meridian)

and the result looks like this in a stereographic projection:

enter image description here

AndreJ
  • 76,698
  • 5
  • 86
  • 162
2

You could georeference it in QGIS using the GeoReferencer tool as you appear to be able to identify common points on both rasters. This would generate a GDAL script with a set of GCP points, and transformation parameters. You could add this script with a sample of these points to your question, as it might explain what the difference between the two projections is.

Worst case scenario, you would have a rough estimate of the values based on the repositioned raster which might help you with your goal.

PolyGeo
  • 65,136
  • 29
  • 109
  • 338
djq
  • 16,297
  • 31
  • 110
  • 182
1

The lower left corner is at (0,0) coordinates, but for me (0,0) is the coordinate of the upper right corner in your case and I don't know any geographic coordinate system with its origin at -90.

As you work in ArcGIS, you could use the georeferencing toolbar to move your data at the right location. Move the upper right to (0,0) and the lower left to (-360, -90) and this should yield an exact transform but you would still have a problem with the dateline.

enter image description here

You can thus try this link which should help you to create a custom geographic coordinate system. To sum it up, in your reference system, create a custom WGS 84 with the prime meridian at -180, then a custom transform using longitude rotation.

enter image description here

Georeferencing in this new system would consist in setting the origin at (-180, -90). One control point is enough because you just need a translation. Carefully select the bottom left pixel, right click and add the exact XY values). Then it should look like this

enter image description here

As a final remark, there is no certainty that the coordinate system is based on WGS 84. But it is for sure a geographic coordinate system in degrees and the resolution of your raster is probably coarser than the potential error due to a wrong datum selection.

radouxju
  • 49,636
  • 2
  • 71
  • 144