4

I am working on a university project in which I need to find a periodic net element in an image.

The net is a set of diagonal lines in a specific angle ( which I don't know in advance ) on a noisy image. They are hard to detect so I would like to use all the information I can get my hands on.

enter image description here

My current algorithm is based on using edge detection + hough transform to find lines at specific angle range.

I was wondering if there is any way to detect periodic signals in image? Something based on ff2 or something like that...

Thanks,

Elad Walach
  • 345
  • 3
  • 9

2 Answers2

4

You could apply a 2d FFT. You will get a frequency spectrum as z values on a 2d plane:

FFT of the example image ← That's log(abs(fftshift(fft2(image))))) where image is from the question, but with white borders trimmed

From the z values you can determine the highest peak and calculate its position on the 2d plane. With some geometric calculation, you can derive wavelength, direction and phaseshift from this.

endolith
  • 15,759
  • 8
  • 67
  • 118
nnn
  • 141
  • 1
  • 2
    I would multiply the spectrum by the radius from its centre. This compensates somewhat for lower frequency components being grouped into fewer bins and therefore having larger amplitudes, when finding the highest peak. – geometrikal Jun 11 '13 at 09:51
  • 1
    would autocorrelation be better than FFT alone? – endolith Jun 11 '13 at 16:14
  • @geometrikal: Is that equivalent to differentiating in the space domain? – endolith Jun 11 '13 at 20:22
  • 1
    @endolith I think differential needs the i as well. I have no mathematical basis for my comment actually.. Just something that seemed to work on some problems I had. Tried on this one and it didn't give anything useful. Though, that big line in the spectrum can be removed by getting rid of the first and last rows in the image, as they are white. – geometrikal Jun 11 '13 at 22:28
  • wow ,that looks good, exactly what i wanted to try..Thanks! – Elad Walach Jun 14 '13 at 18:30
3

Another approach might be to perform the Radon / Hough transform first, then detect the points.

e.g. R = radon(I,0:179) in MATLAB.

It gives this image:

enter image description here

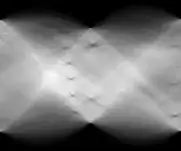
The x-axis is angle (0-180 deg) and the y-axis is distance from the centre. Each local minimum represents a line. It shows 6 lines ~75 degrees, 2 around 90 degrees, and 3 around 170 degrees. (This is MATLAB angles which go clockwise from x-axis because the y-coords are upside down)

Edit: Forgot Radon and Hough transforms were roughly the same.

Update:

I wrote some MATLAB code to locate the angles and mean separation between lines.


close all
I = imread('testt.jpg');
I = rgb2gray(I);
I = I(2:end-1,:);

% Radon transform
R = radon(I,0:179);
imagesc(R); colormap gray(256); pause;

% Radon transform of smoothed image
Rg = radon(imgaussian(I,2),0:179);
imagesc(Rg); colormap gray(256); pause;

% Take it away
Rf = R - Rg;
imagesc(Rf); colormap gray(256); pause;

% Chop off out of range parts
chop = size(Rf,1) - size(I,1);
chop = ceil(chop/2);
Rf = Rf(chop+1:end-chop,:);
imagesc(Rf); colormap gray(256); pause;

% Negative lines - threshold
Rf(Rf > 0) = 0; 
imagesc(Rf); colormap gray(256); pause;

% Plot sum - peaks are angles
Rp = sum(abs(Rf));
plot(Rp);

% Get the peaks sep by at least 15 deg
[p,a] = findpeaks(Rp,'minpeakdistance',15,'sortstr','descend');
hold on;
scatter(a,p,'r*');
hold off;
pause;

% Iterate through peaks and find fequencies
for j = 1:numel(a)
    % Get subsection of Radon transform around angle and transpose
    vstart = max([a(j)-10,1]);
    vend = min([a(j)+10,size(Rf,2)]);
    Rsub = Rf(:,vstart:vend).';
    imagesc(Rsub); colormap gray(256); pause;
    RsubP = sum(abs(Rsub));
    plot(RsubP); pause;

    % Find peak correlation with a bit of smoothing
    xp = xcorr(imgaussian(RsubP,2),imgaussian(RsubP,2));
    plot(xp); pause;
    [rp,rl] = findpeaks(xp,'sortstr','descend');
    wave(j) = abs(rl(1) - rl(2));
    disp(['Angle: ' num2str(a(j))]);
    disp(['Wavelength: ' num2str(wave(j))]);
    disp(['Strength: ' num2str(p(j))]);
    pause;
end

which results in: (red * are possible angles)

enter image description here

and

Angle: 73
Wavelength: 16
Strength: 12401.356

Angle: 92
Wavelength: 54
Strength: 9442.2545

Angle: 175
Wavelength: 33
Strength: 9030.1877
geometrikal
  • 3,616
  • 15
  • 27