I want to help someone with a homework in signal processing, and the courses he provided are some slides, without clear definitions in them. I am required in solving a problem to represent the amplitude spectrum and the phase spectrum of a given signal. I searched the internet and didn't found the definitions of these two. I want to create a Matlab script for these, but if I don't know the definitions I cannot do that. Please give me the definitions for these.
- Amplitude spectrum
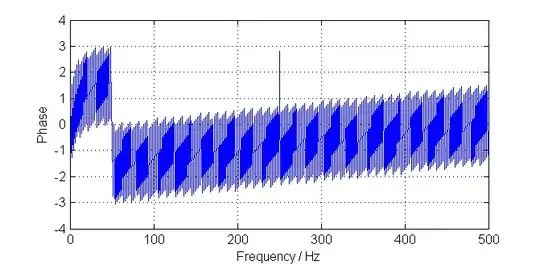
- Phase spectrum
If there is a Matlab command, or some other program which plots these spectrums directly, I would be very interested. Thank you.