I have an insert statement generated by the .NET Entity Framework. In most cases, this particular insert will execute in 0ms according SQL Server Profiler.
One out of every 30 or so inserts will jump to as high as 12 seconds duration, causing the .NET client on the other end to show as "Not Responding" while it waits. Server load should not be an issue as our server is very, very lightly loaded.
Here is the table the insert is being performed against:
SET ANSI_NULLS ON
GO

SET QUOTED_IDENTIFIER ON
GO

SET ANSI_PADDING ON
GO

CREATE TABLE [dbo].[ProductEvents](
[EventID] [int] IDENTITY(1,1) NOT NULL,
[KID] [int] NOT NULL,
[EventDescription] [varchar](50) NOT NULL,
[EventDate] [datetime] NOT NULL,
[UserName] [varchar](50) NOT NULL,
[Notes] [varchar](max) NOT NULL,
[Version] [timestamp] NOT NULL,
[IsSynchronized] [bit] NOT NULL,
[LastSyncDate] [datetime] NULL,
 CONSTRAINT [PK_ProductEvents] PRIMARY KEY CLUSTERED
([EventID] ASC ) WITH (PAD_INDEX = OFF, STATISTICS_NORECOMPUTE = OFF,
IGNORE_DUP_KEY = OFF,ALLOW_ROW_LOCKS = ON, ALLOW_PAGE_LOCKS = ON) ON [PRIMARY]
) ON [PRIMARY] TEXTIMAGE_ON [PRIMARY]

GO

SET ANSI_PADDING OFF
GO

ALTER TABLE [dbo].[ProductEvents] ADD  CONSTRAINT [DF_ProductEvents_IsSychronized]
DEFAULT ((0)) FOR [IsSynchronized]
GO

ALTER TABLE [dbo].[ProductEvents]  WITH CHECK ADD  CONSTRAINT
[FK_ProductEvents_Products] FOREIGN KEY([KID])
REFERENCES [dbo].[Products] ([KID])
ON DELETE CASCADE
GO

ALTER TABLE [dbo].[ProductEvents] CHECK CONSTRAINT [FK_ProductEvents_Products]
GO
And the query as seen by SQL Server Profiler (actual example):
exec sp_executesql N'insert [dbo].[ProductEvents]([KID], [EventDescription],
[EventDate], [UserName], [Notes], [IsSynchronized], [LastSyncDate])
values (@0, @1, @2, @3, @4, @5, null)
select [EventID], [Version]
from [dbo].[ProductEvents]
where @@ROWCOUNT > 0 and [EventID] = scope_identity()',N'@0 int,@1 varchar(50),@2
datetime2(7),@3 varchar(50),@4 varchar(max) ,@5
bit',@0=1894,@1='Modified',@2='2013-08-12
08:09:25.4766233',@3='KNEXTION\aellison',
@4='Description changed from Mini Awareness Ribbon Cookie Cutter - RM 1698 to Mini
Awareness Ribbon Cookie Cutter - R&M 1698.',@5=0
Here is the execution plan as a screenshot from SSMS:
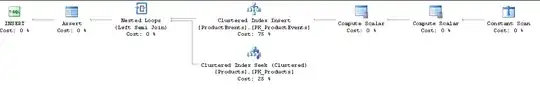
Any ideas on how to begin to track this down?
The actual and estimated plans seem to be the same.
It is a multi-user application, and this table would be one of the more active tables.
Is there any easy way in the Profiler or any other tool to see if blocking is the issue? Are there any other issues I should be looking for besides blocking?