12

I'm fitting a psychometric function to a range of data. The majority of this data lends itself to a sigmoidal fit (i.e. participants can do the task), but some individuals are absolutely unable to do the task. I'm planning to compare the slopes obtained from different conditions, but I've hit a wall with the unable-to-do-the-task data.

enter image description here

Fitting a function to this data, the slope should be nearly flat, right? However, the data is really noisy and some weird fitting is occurring - I end up getting erroneously high slopes. I'm using pypsignifit, the parameters I'm using can be seen below. Any idea how to stop this happening?

num_of_block  = 7
num_of_trials = 20

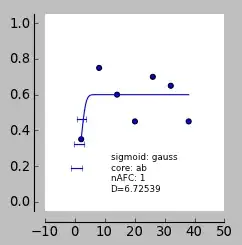
stimulus_intensities=[3, 7, 13, 20, 27, 32, 39] # stimulus levels
percent_correct=[.38, .75, .6, .43, .7, .65, .43]     # percent correct sessions 1-3
num_observations     = [num_of_trials] * num_of_block      # observations per block
data= np.c_[stimulus_intensities, percent_correct, num_observations]
nafc = 1
constraints = ('unconstrained', 'unconstrained', 'unconstrained', 'Beta(2,20)' )
boot = psi.BootstrapInference ( data, core='ab', sigmoid='gauss', priors=constraints, nafc=nafc )
boot.sample(2000)
print 'pse', boot.getThres(0.5)
print 'slope', boot.getSlope()
print 'jnd', (boot.getThres(0.75)-boot.getThres(0.25))
Tyler Mc
  • 280
  • 1
  • 10
luser
  • 386
  • 3
  • 7
  • 3
    The data look really like the participant performed on chance level. Actually, I would not try to fit them at all, because the fits cannot get better than your example. – H.Muster Jun 03 '12 at 17:09
  • That's exactly what happened. It may be counterintuitive to try to fit the data, but I really want to be able to compare the slope of these participants with ones who performed better using something like a t-test. Hence the 'need' to fit. – luser Jun 03 '12 at 18:09
  • Then I would try different psychometric functions (e.g, logistic, Weibull) until I find one that is fitted to the data as a straight line with a slope of almost zero. – H.Muster Jun 03 '12 at 19:30
  • Makes sense, but the main issue I have is I'd have to arbitrarily choose when to use this alternative fit. The same participant appeared to perform at chance on another condition, but the cumulative gaussian fitted well and showed a not-immediately-apparent slope. – luser Jun 03 '12 at 20:08
  • 2
    I would not suggest to use different functions for individual fits, but use one functions for all, i.e., choose the function that gives the best overall solutions. Concerning the bad cases: did you try to seed the estimation routine with starting values nearer to 0.5 for the guessing rate and the lapsing rate? – H.Muster Jun 04 '12 at 05:56
  • Upon reflection, that was obvious. Sorry! Seeding with values close to 0.5 does not help, nor does changing function - the obscure slope from the first data-point is still there. Ideally I'd just not use that data in my analyses, but seeing as the whole point of this venture is to compare those who are 'good' as the task compared to those who are not... – luser Jun 04 '12 at 13:04
  • Another idea: try to constraint lapsing rate and guessing rate to values between 0.3 and 0.8 (i.e., the minimum and maximum percent correct rate in the data set your picture is based on). – H.Muster Jun 04 '12 at 14:28
  • Is this a Yes/No task, or a 2AFC design? – Ofri Raviv Jun 11 '12 at 20:03
  • What exactly is the plot showing? Is it data from a single participant or data for an item? Since there are no lables for the axes, what is plotted on the x- and y-axis? It looks like the y-axis could be the probability for getting the right answer since it goes from 0 to 1. Is that correct? – Jens Kouros Jun 30 '13 at 15:20
  • I'm curious if you've solved the problem in the meantime and how did you finally approach it. – the gods from engineering Jan 07 '18 at 07:20

2 Answers2

3

What you are looking for is called Hierarchical, Multi-level or Random-effects model. In your particular case the solution is a hierarchical logistic regression.

Assume $y_{st} \in \{0,1\}$ is the response of subject $s$ on trial $t$ and $x$ is the dependent variable then a simple hierarchical model that solves your problem is:

$y_{st}\sim \mathrm{Bernoulli}(\mathrm{logit}(\alpha_s+\beta_s x))$

$\beta_s \sim \mathcal{N}(\mu,\sigma)$

where $\mu$ is the population value of the slope and $\beta_s$ is the subject level estimate. Roughly, $\mu$ is a weighted average of all $\beta_s$ where the weight of each $\beta_s$ is inversely proportional to the variance of the estimate of $\beta_s$. For more details on hierarchical logistic regression and for extensions of the simple model, that I have suggested above, refer to Chapter 14 in Gelman & Hill (2006).

Fitting a function to this data, the slope should be nearly flat, right?

No. The slope should be uncertain. Flat slope looks differently, say $(10,0.61), (20,0.59),(30,0.6),(40,0.58),(50,0.6)$. The corresponding estimate of $\beta$ should show wide interval such that you can't conclude that $\beta>0$ or $\beta<0$ or $\beta=0$ (as you suggested).

How will a hierarchical model handle such uncertain $\beta_s$? This $\beta_s$ will contribute little to the estimate of $\mu$. Instead $\beta_s$ for this particular subject will be pulled towards $\mu$. The hierarchical model will effectively tell you that if your data is inconclusive, it will just assume that the subject is a typical member of the population (that is if $\mu$ had been estimated reliably) and discard the erratic data.

Literature: Gelman, A., & Hill, J. (2006). Data analysis using regression and multilevel/hierarchical models. Cambridge University Press.

matus
  • 309
  • 1
  • 9
1

At the heart of the matter is the fact that 60% "yes" responses independent of the stimulus level (i.e., the problematic data) can arise from both an extremely sensitive subject (i.e., steep slope) with a moderate bias and a high lapse rate and an extremely insensitive subject (i.e., shallow slope) with a moderate bias and a low lapse rate. For your data the steep slope/high lapse rate fit is slightly better than the shallow slope/low lapse rate when your prior on the lapse rate is based on a Beta distribution. My guess is if you used a uniform prior on the lapse rate, and possibly on the guessing rate, this will result in the shallow slope fit being better. I would try something like "Uniform(0,0.1)".

StrongBad
  • 2,633
  • 14
  • 27