8

While writing this answer to the question Transmitter receiver coil separation for Electromagnetic Terrain Conductivity Measurement I ran across this large PDF file of a book Soil and Environmental Analysis; Physical Methods Soil and Environmental Analysis; Physical Methods, 2nd Ed. K. A. Smith and C. E. Mulllins, Eds. 2000 Dekker, New York.

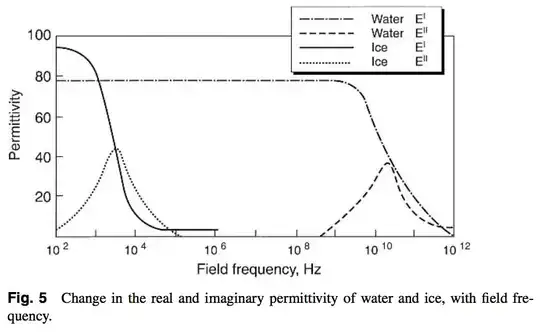
Figure 5. on page 29 is shown below. It shows a plot of the real and imaginary part of the permittivity of water in solid (ice) and liquid forms.

The shapes are the roughly the same; the real part is around 80 to 90 at low frequency and drops to perhaps 2 to 1 at high frequency, with the imaginary part reaching a peak as the slope of the real part is maximum as one would expect.

The difference however is that the peak in the absorption is around 3 kHz for ice and 20 GHz for liquid!

  1. Is the physics behind this strong absorption peak the same in both cases?
  2. If so, what is it about the transition from solid to liquid that can move it seven orders of magnitude?

enter image description here

uhoh
  • 5,778
  • 3
  • 31
  • 101
  • 1
    Wow, great question! Maybe this paper will shed some light: J.H. Jiang, D.L. Wu, Ice and water permittivities for millmeter and sub-millimeter remote sensing applications, Atmos. Sci. Let., 5 (2004) 146-151. The authors are/were at JPL at CalTech. The paper is not paywalled. I hope to read (and understand) a good answer here! – Ed V Jul 13 '19 at 22:53
  • @EdV Wow that looks quite helpful for the GHz line at least (radar doesn't usually go down to kHz); I'll give it a read, thanks! It's open access here and also posted at JPL here – uhoh Jul 13 '19 at 23:06
  • @uhoh From https://physics.nist.gov/cgi-bin/MolSpec/mole.pl?prefix=tri&molecule=H2O one may find examples about water and absorptions, typically GHz though (and not kHz) -- only accessing their references will tell if it was liquid, or solid water probed. – Buttonwood Jul 14 '19 at 00:02
  • 1
    Please note: This is a relaxation spectrum. The transitions do not come from a resonance (absorption, like in NMR, IR, etc.), but an applied electric field has a lossy (at low frequencies) or elastic (at higher f.) effect on some mode of molecular orientation of electrical dipoles in your sample. – Karl Jul 14 '19 at 08:51
  • 1
    https://en.wikipedia.org/wiki/Dielectric_spectroscopy – Karl Jul 14 '19 at 08:57
  • @Karl reading now... – uhoh Jul 14 '19 at 13:28
  • I am not an expert in this, but IMHO, it is quite obvious the imaginary parts have their local maxima near the middle of the transition of the real parts. It is the transition region where dipole angular motion is still partially able to follow the frequency, but with difficulties and with a phase shift between external intensity and overall dipole polarization. So the question rather is, why is such big frequency difference for the permittivity drop for water and ice, with the probable answer involving motion restictions in solids. – Poutnik Apr 08 '22 at 08:23
  • @Poutnik yes, the question has two parts; 1) "Does water really have..." and 2) "Why the huge shift?" The first part requires some authoritative confirmation that the illustration I've shown (it can't be actual data, at best it's some simple parameterization) and the second part is your "the question rather is". I'm going to implement some question re-bountying because... enquiring minds want to know! :-) – uhoh Apr 14 '22 at 04:10
  • 1
    Intuitively I know the answer, bit it is not authoritative. – Poutnik Apr 14 '22 at 05:44

0 Answers0